PC-Seg: Progressive Cross-View Consistency for 3D OCT Segmentation from Sparse 2D Annotations

1Graduate School of Information Sciences, Tohoku University, Japan
2Department of Ophthalmology, Graduate School of Medicine, Tohoku University, Japan
3Institute of Ophthalmology, University College London, UK
4NIHR Biomedical Research Centre at Moorfields Eye Hospital NHS Foundation Trust, UK
5UCL Hawkes Institute, University College London, UK
6Department of Computer Science, University College London, UK
konno@aoki.ecei.tohoku.ac.jp

Abstract

Volumetric segmentation of Optical Coherence Tomography (OCT) images is essential for diagnosing ocular diseases but requires labor-intensive voxel-wise annotations. While semi-supervised learning (SSL) can reduce annotation costs, most existing methods process data slice-by-slice, failing to exploit the inherent 3D spatial context. We propose PC-Seg (Progressive Cross-view Segmentation), a curriculum learning framework that lifts sparse 2D annotations to high-precision 3D segmentation models. A single 2D model learns cross-view consistency from standard B-scans and orthogonal slices to generate reliable volumetric pseudo-labels. These labels are distilled into a 3D model, followed by co-training in which the 2D and 3D models mutually refine each other through ensemble pseudo-labeling. On the MSHC and Duke DME datasets, PC-Seg achieves accuracy comparable to fully supervised learning using only about 0.7% of the labeled data and outperforms state-of-the-art semi-supervised and retinal layer segmentation methods.

Introduction

Retinal layer thickness in Optical Coherence Tomography (OCT) serves as a critical biomarker for ocular diseases such as glaucoma and diabetic retinopathy. While deep learning has achieved high segmentation accuracy, it typically demands large-scale pixel-wise annotations, which are labor-intensive to obtain. Semi-supervised learning approaches aim to mitigate annotation costs; however, most existing methods are restricted to 2D slice-wise processing and fail to capture the inherent 3D spatial context.

In other 3D medical imaging domains, such as CT and MRI, 3D context is effectively captured via multi-view co-training among 3D networks or cross-teaching between 2D and 3D networks. However, OCT volumes exhibit strong anisotropy, and sparse annotations are typically limited to standard B-scans. Consequently, applying methods that utilize annotations on orthogonal planes or dense voxel-wise labels requires additional manual annotation. Moreover, simultaneously training multiple networks from scratch is computationally expensive and highly susceptible to overfitting when annotations are extremely sparse (e.g., only a few 2D slices).

To address the above issues, we propose Progressive Cross-view Segmentation (PC-Seg), a novel framework that lifts sparse 2D annotations to high-precision 3D segmentation by a five-stage curriculum learning strategy.

Progressive Cross-View Segmentation

PC-Seg progressively expands the target views and dimensions to prevent error accumulation in pseudo-labels. It first refines pseudo-labels using a lightweight 2D ResUNet before introducing a 3D ResUNet. Cross-view consistency enables the 2D model to learn from standard and orthogonal B-scans and generate reliable volumetric pseudo-labels, which are then distilled into the 3D model. Both models are trained using a UniMatch-based semi-supervised learning framework.
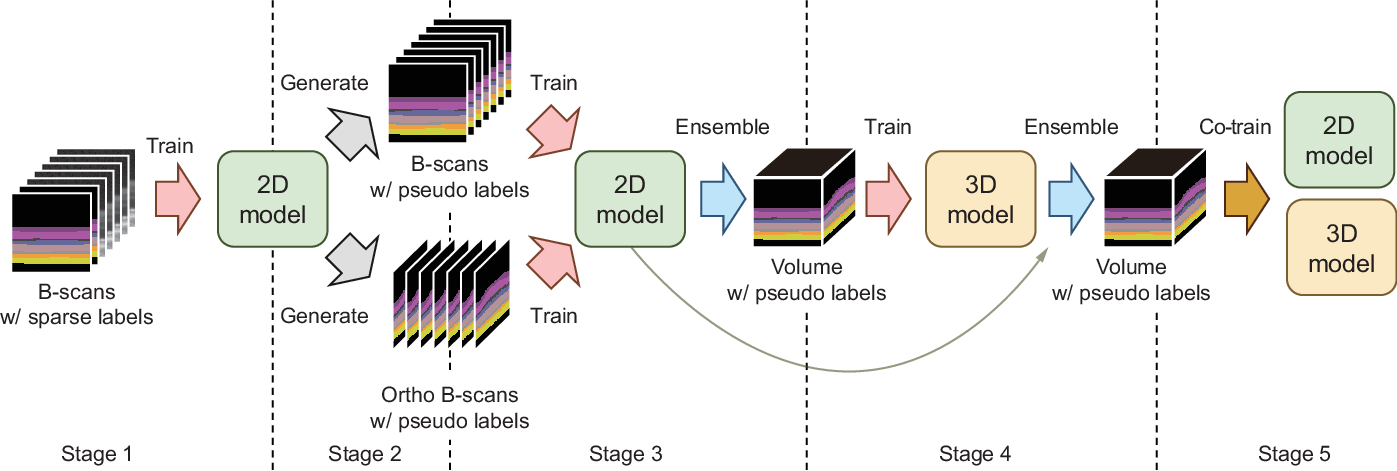
Overview of the five-stage curriculum learning strategy in PC-Seg
Fig. 1. Overview of the five-stage curriculum learning in PC-Seg. The 2D model trained in Stage 3 is reused in Stage 5 for the final ensemble.

Stage 1 2D Warm-up

Train a 2D model on sparsely labeled and unlabeled B-scans using UniMatch, and use its predictions to generate initial pseudo-labels for orthogonal B-scans in Stage 2.

Stage 2 Orthogonal Adaptation

Introduce unlabeled orthogonal B-scans and train the 2D model using the pseudo-labels generated in Stage 1. Consistency is enforced for predictions under weak, feature-level, and two strong perturbations.

Stage 3 Cross-teaching

Mutually generate pseudo-labels between the standard and orthogonal planes. The resulting 2D probability maps are stacked with coordinate permutation to generate high-quality 3D pseudo-labels.

Stage 4 3D Distillation

Train a 3D model on sparsely labeled and unlabeled OCT volumes using the volumetric pseudo-labels generated in Stage 3. Ground-truth labels are used on annotated slices, while pseudo-labels guide the remaining slices and unlabeled volumes.

Stage 5 2D/3D Co-training

Alternately train the 2D and 3D models while dynamically updating ensemble pseudo-labels from both models, enabling them to mutually refine each other.
Experiments

MSHC Dataset

35 OCT volumes with nine retinal layer boundaries, split into 12 training, 3 validation, and 20 test volumes. The semi-supervised settings use only 6, 30, or 60 labeled patches out of 8,820 training patches (approximately 0.07%, 0.3%, and 0.7%).

Duke DME Dataset

10 OCT volumes with eight retinal layer boundaries and fluid annotations, split into 6 training, 2 validation, and 2 test volumes. Training uses 66 labeled and 300 unlabeled B-scans.

Quantitative Results

We report the final predictions of the 2D model on B-scans and orthogonal B-scans, the 3D model on OCT volumes, and the ensemble of these three predictions. With only 60 labeled MSHC patches, corresponding to approximately 0.7% of the 8,820 training patches, PC-Seg achieves accuracy comparable to fully supervised methods trained on the entire training set.

F-scores on the flattened MSHC dataset.
Method 6 labels 30 labels 60 labels Full (8,820)
SGNet 0.79 0.79 0.79
SD-LayerNet 0.82 0.84 0.86
GOctSeg 0.87 0.86 0.88
Structured-Layer (Full) 0.9193
1D+2D U-Net (Full) 0.9198
SemiVL 0.8103 0.8919 0.9085 0.9185
2D ResUNet w/ UM 0.8744 0.9079 0.9135 0.9168
3D ResUNet 0.6822 0.9069 0.9112 0.9176
3D ResUNet w/ UM 0.7843 0.9112 0.9121
PC-Seg 2D (B-scan) 0.9016 0.9129 0.9155 0.9164
PC-Seg 2D (Ortho) 0.9027 0.9128 0.9138 0.9164
PC-Seg 3D (Volume) 0.9020 0.9133 0.9142 0.9176
PC-Seg (Ensemble) 0.9047 0.9157 0.9174 0.9212

On the Duke DME dataset, the ensemble achieves a mean F-score of 0.848 and a fluid F-score of 0.742. The improved fluid segmentation performance demonstrates the benefit of incorporating 3D spatial context for identifying complex pathological structures.

F-scores on the flattened Duke DME dataset.
Method ILM NFL-IPL INL OPL ONL-ISM ISE OS-RPE Fluid Mean
TCCT 0.88 0.91 0.79 0.79 0.90 0.90 0.87 0.648 0.836
SA CNN 0.88 0.91 0.78 0.78 0.90 0.91 0.89 0.536 0.823
GD-Net 0.87 0.91 0.79 0.79 0.91 0.91 0.89 0.641 0.839
2D ResUNet w/ UM 0.88 0.91 0.80 0.79 0.90 0.91 0.86 0.635 0.835
SemiVL 0.86 0.90 0.78 0.78 0.89 0.90 0.84 0.590 0.818
3D ResUNet w/ UM 0.83 0.85 0.73 0.71 0.89 0.87 0.70 0.670 0.780
SASR 0.87 0.91 0.78 0.77 0.88 0.90 0.88 0.459 0.807
DyCON 0.79 0.85 0.71 0.69 0.89 0.90 0.87 0.466 0.771
PC-Seg 2D (B-scan) 0.88 0.92 0.81 0.77 0.90 0.91 0.88 0.709 0.847
PC-Seg 2D (Ortho) 0.87 0.90 0.77 0.72 0.90 0.90 0.88 0.726 0.833
PC-Seg 3D (Volume) 0.87 0.90 0.77 0.74 0.90 0.90 0.88 0.736 0.838
PC-Seg (Ensemble) 0.88 0.91 0.80 0.76 0.90 0.90 0.88 0.742 0.848

Qualitative Results

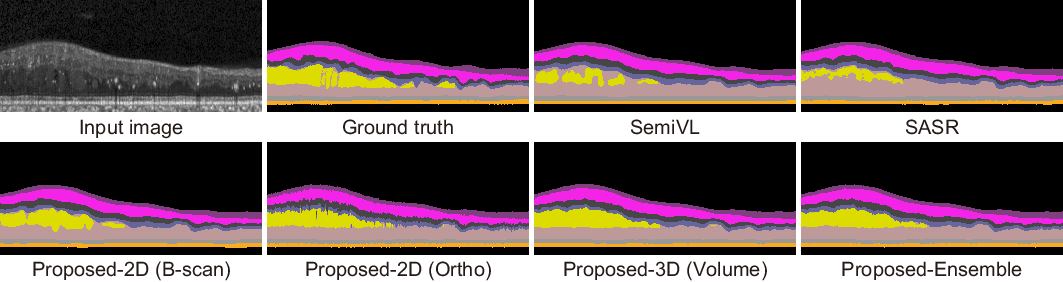
Slice-wise methods tend to miss or under-segment fluid regions. The orthogonal 2D model captures the lesions more completely but introduces inter-slice inconsistencies, resulting in striping artifacts. In contrast, the 3D model effectively reduces these artifacts by leveraging volumetric context. The final ensemble achieves the highest segmentation fidelity, accurately preserving both retinal layers and lesion shapes.

Qualitative segmentation comparison on the Duke DME dataset
Fig. 2. Qualitative comparison of segmentation results on the Duke DME dataset.

BibTeX

@inproceedings{konno2026pcseg,
  author    = {Konno, T. and Ninomiya, T. and Zhou, Y. and Ito, K. and Wagner, S. K. and
               Lin, Y. and Keane, P. A. and Nakazawa, T. and Aoki, T.},
  title     = {{PC-Seg}: {P}rogressive Cross-View Consistency for {3D} {OCT} Segmentation
               from Sparse {2D} Annotations},
  booktitle = {Medical Image Computing and Computer Assisted Intervention},
  year      = {2026}
}

This work was supported in part by JSPS KAKENHI Grant Numbers 23H00463, 25K03131, and 25KJ0629, and the WISE program for Artificial Intelligence and Electronics in Tohoku University.